Prototyping phase
By developing a set of mobile applications for both military and civilian population, this project aims to contribute with several parts of the humanitarian de-mining process. Such as: Non-technical survey, Technical survey and clearance.
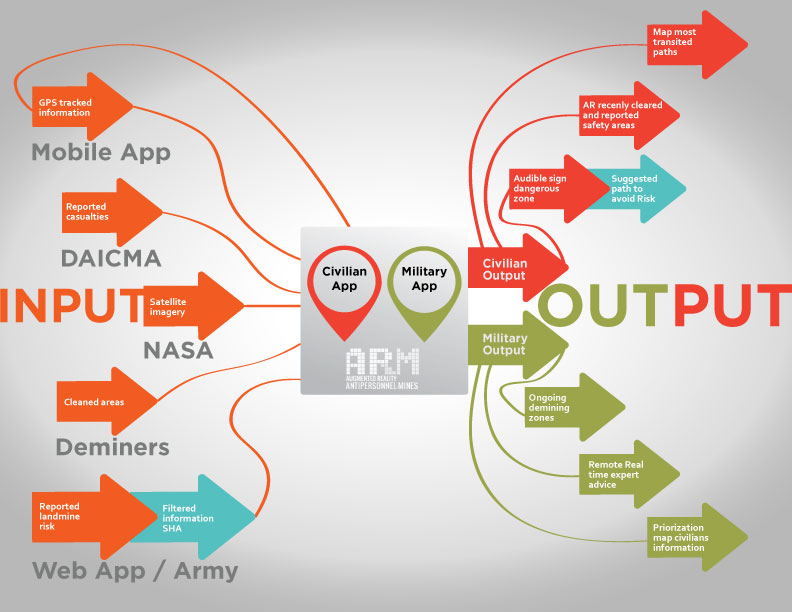 Figure 04: Diagram for Inputs and Outputs of civilian and military apps
Fig. 04 This figure was designed to define both applications in terms of Inputs and Outputs as follows:
Information Sources: The words in gray in the diagram correspond to information sources, those are the places or entities were information comes from, either official or unofficial.
System Input: arrows in orange correspond to the system input which in planned to be the same for both civilians and military apps and the arrow in ocean blue corresponds to a filter done by an official entity in order to formalize that data.
GPS tracked information from army guerrilla and civilians using paths. Previous reported casualties from 1990 to 2015 Lat/long High Resolution satellite imagery Cleaned areas ready for official release Reported landmine risk information from civilian population / Filtered information from Colombian Army about SHA.
System Output: The system output is divided into 2 parts, the red arrows correspond to the civilian app y the green arrows correspond to the military app as follows:
Civil
Report in a map of the most transited paths used recently by app users. Information on top of the terrain with recently cleared and reported safety areas. Audible sign when the user is approaching to a dangerous zone.
Military
Ongoing demining zones. Remote Real time expert advice. Priorization map based on civilian information.
Prototype 1 Augmented Reality APP
The first prototype for the project was an Augmented Reality app developed for a mobile phone with the idea of testing how extra information might be placed on top of both, the field and specific objects in the user's field of vision. As a proof of concept one image was created to show the public how the app was intended to work. (see fig. 05)
 Figure 05: Photo-montage of a soldier using a head-set with Augmented reality app, facing a mine field.
App Operation
This app will rely in official information from Colombian Government, the first step is to define whether if there is risk of landmines in the field or not. For this step, information about Non Technical Survey is required. That information is added to the app database in order to determine the risk zones. Once validated the location of the dangerous zones, there are two possibilities. On the one hand, for military people, the application will show information on top of the field and will add layers to the vision of de-miner to show the kind of risk the user is facing.(fig. 06) And in the other hand, for civilians the application will show the user, the best way to avoid the identified risk zones, by giving him visual information of the safest route to avoid the artifact (all information will be placed over the field as an extra layer of information to reality)(fig. 07).
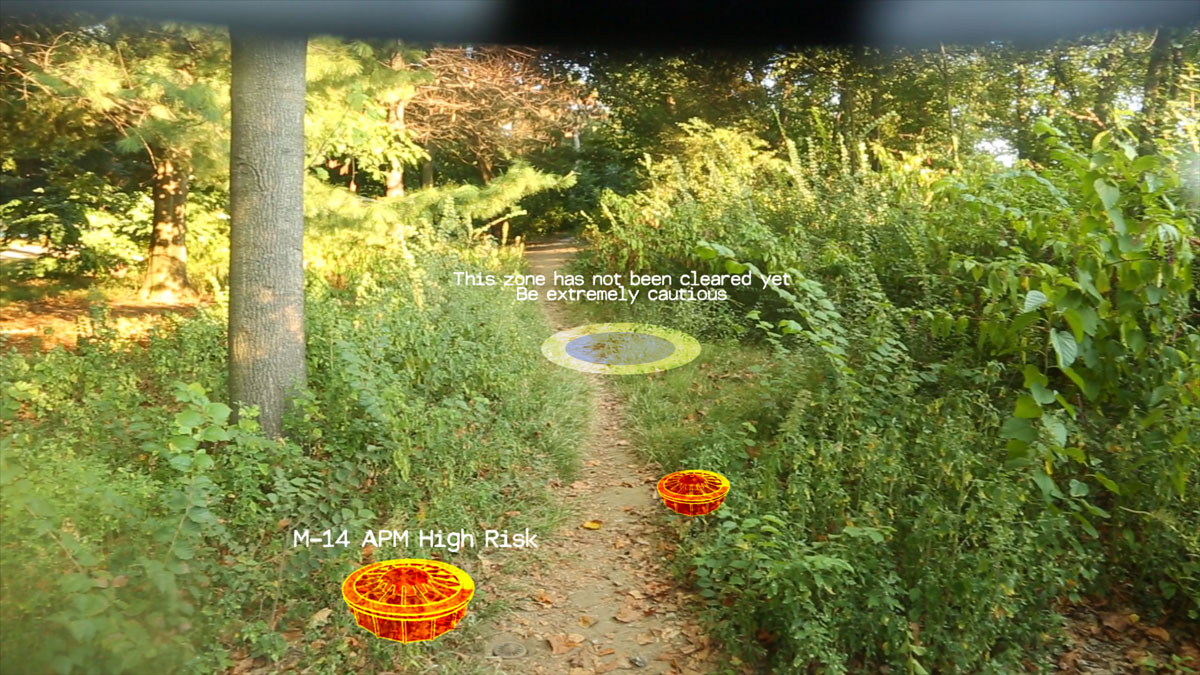 Figure 06: Augmented Reality app for mobile phones, showing the threats of landmines. Based in POI (Point of Interest) information.
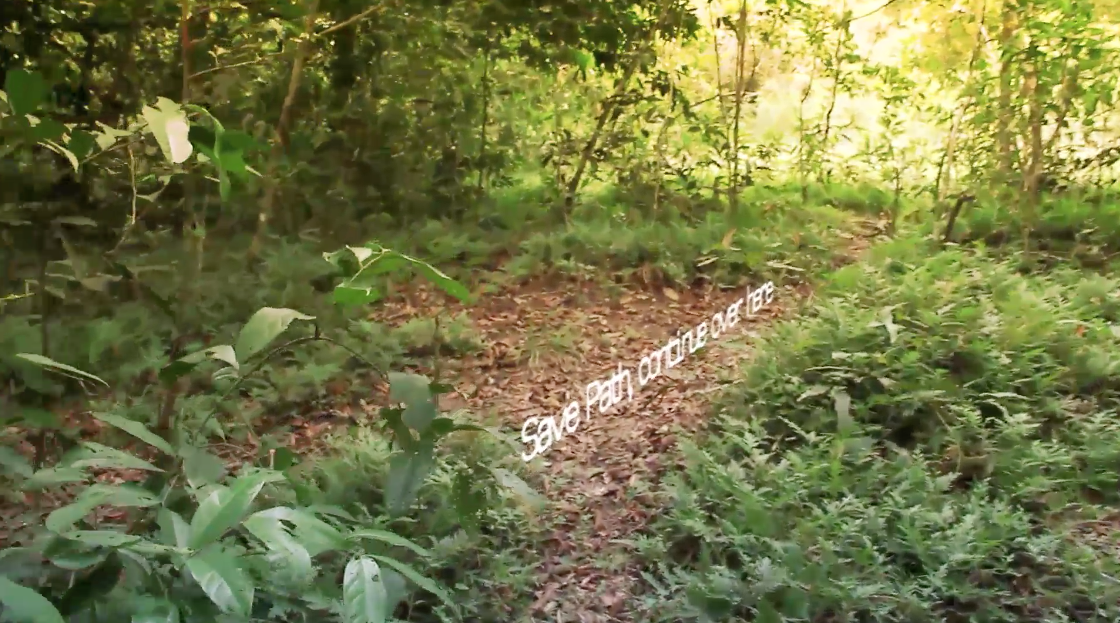 Figure 07: Augmented Reality app for mobile phones, showing civilian users the safest path to avoid landmine risk.
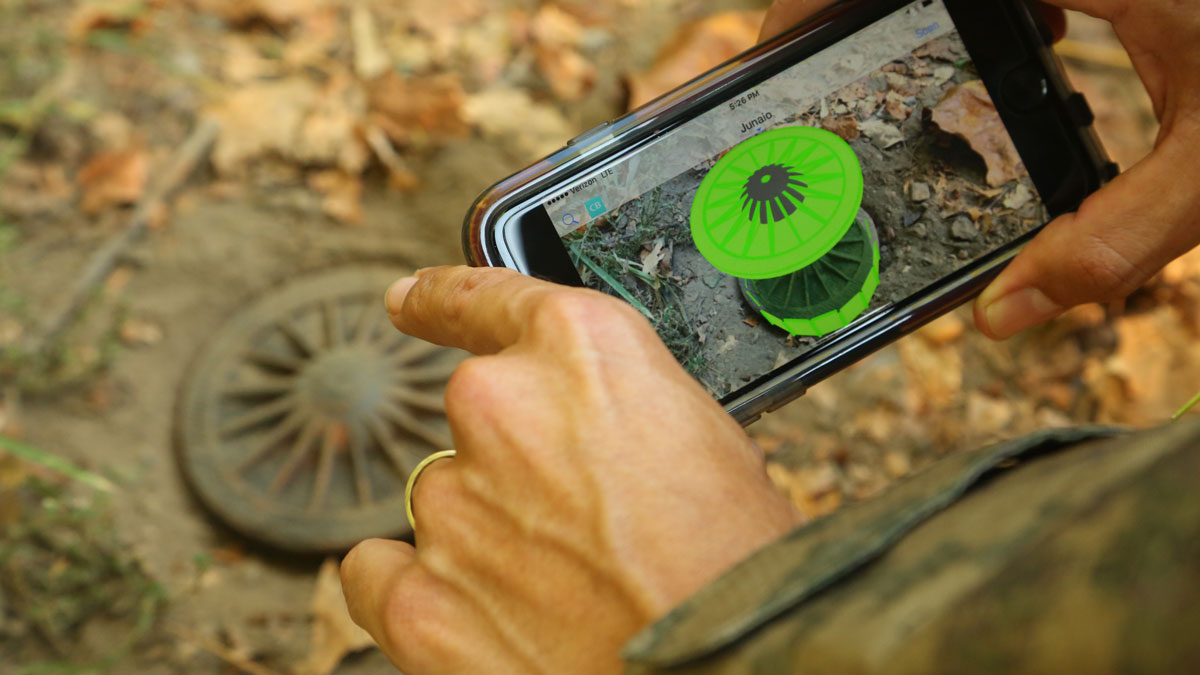 Figure 08: Augmented Reality app for mobile phones, showing information about an specific typology of landmine.
Fig. 08 This figure explains one of the main features suggested for further development. By using edge face recognition the augmented reality app is able to look for specific geometries stored in a 3D elements database. Those 3D elements can store information related to the internal composition on the explosive device to provide an extra set of eyes to the deminers, such information was added to the application in the form of 3D animations, that the user can play by tapping the screen of the device.
Technologies
List of tools, technologies and materials:
- A mobile device (could be a cellphone, an augmented reality device such as epson moverio, Microsoft Hololens or Daqui helmet I would prefer the last one considering that it has been tested for both military and industrial applications).
- An augmented reality SDK for the first tryout I’m using metaio SDK, yet I’m planning to move to Vuforia.
- A 3D Modeling software (or 3d models of existing landmine typologies) for this particular case maya I used Maya.
- A Geo-located database: A database that contains latitude and longitude coordinates to locate certain point in the earth's surface.
- A 3D printed model of a conventional landmine.
Lessons
The most important lessons from the development of this prototype were:
- The importance of official information as a reliable source of information for users.
- Due to the complexity of the improvised devices buried in Colombia, this prototype needs to be refined to the point that can be able to detect those particularities in the geometry of such devices.
- In the case of civilian population an Augmented Reality app is not necessary for inhabitans of rural zones. The real value of the prototype was founded in the military field.
Prototype 2 Landmine geo-located information on a map
For the second prototype I received the information from all the previous casualties in Colombia since 1990 directly from the Colombian government. This information allowed me to develop a prototype to place the geolocated information on a map, to visualize the zones were artifacts exploded in the last 25 years. This was the first attemp to vizualize information related to landmines for this project.
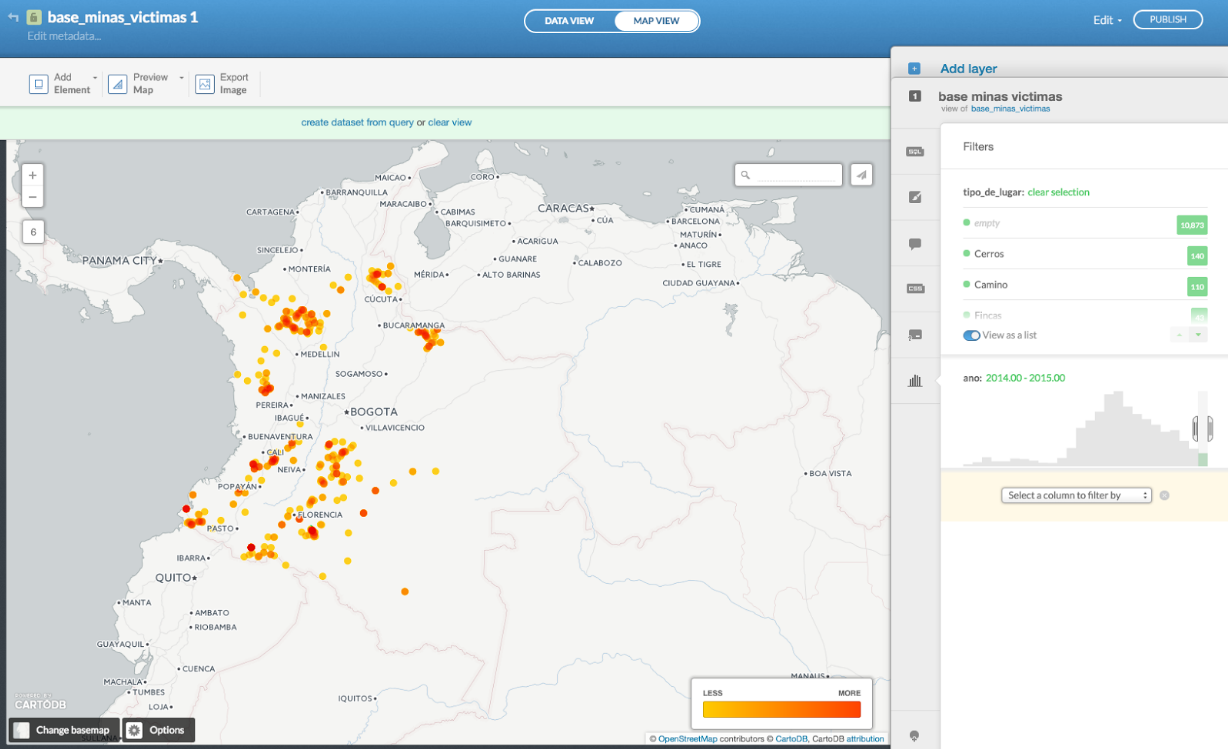 Figure 09: Visualization of the landmine casualties in Colombia in 2015
App Operation
This app uses the information gathered by the Colombian Government to place landmine casualties for the civilian users for them to have reliable and accessible information. (see fig. 09) Information can be easily filtered to know were the suspected zones are and to classify information according user needs.
Technologies
List of tools, technologies and materials:
- CartoDB: A Software as a Service (SaaS) cloud computing platform that provides GIS (geographical information system) and web mapping tools for display in a web browser. CartoDB users can use the company's free platform or deploy their own instance of the open source software.
- A Geo-located database
Lessons
The most important lessons from the development of this prototype were:
- Information visualization might be a powerful tool for users to have access to considerable amounts of information.
- Maps are useful to analyze and deliver clear and accurate landmine related information.
- Display information on a map, without mindful filtering tools. Might generate unwanted effects in users such as panic or confusion.
Prototype 3 Mobile App
The third and last prototype was developed for the civilian population. Based on the experience and feedback from the two previous. This prototype aims to provide a safe an portable tool for inhabitants of rural zones in Colombia. Providing them guidance on their everyday commutes.
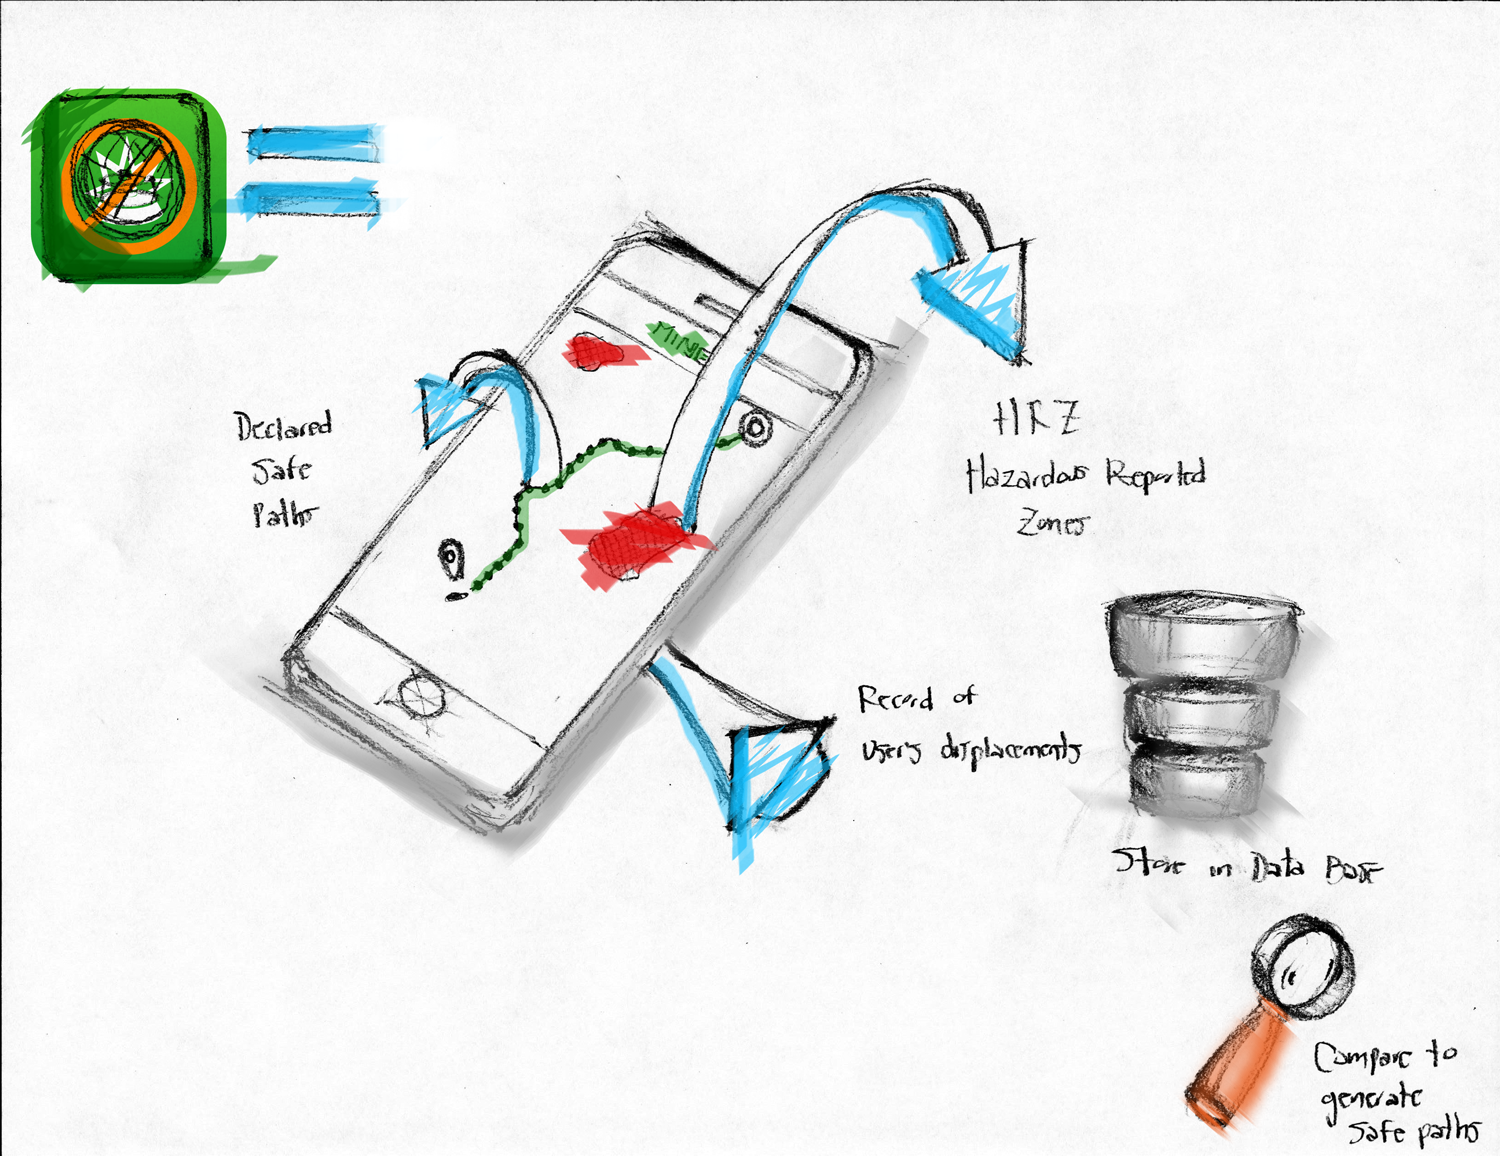 Figure 10: Diagram of the three main features of the mobile app
App Operation
This app has three main features:
- Show the safest path for users to go from a determinate location to a desired point. Avoiding the risk of landmines by using an algorithm to avoid points in the space.
- Show the user the SHA if desired while the user is navigating the field. Providing an audible signal when the user is going out of path or getting closer to dangerous zones.
- Record and compare the user movements to establish safe paths based on users information.
Technologies
List of tools, technologies and materials:
- X-code
- Axure RP Pro: A wireframing, rapid prototyping, documentation and specification software tool aimed at web and desktop applications.
- A Geo-located database
- Mapbox:A mapping platform for developers
- Mapbox Studio Classic: is a desktop app for designing beautiful maps and converting custom datasets into compact vector tiles.
- Mapbox iOS SDK: An open-source framework for embedding interactive map views with scalable, customizable vector maps into Cocoa Touch applications on iOS 7.0 and above using Objective-C, Swift, or Interface Builder. It takes stylesheets that conform to the Mapbox GL Style Specification, applies them to vector tiles that conform to the Mapbox Vector Tile Specification, and renders them using OpenGL.
- Swift 2: A modern programming language that is safe, fast, and interactive.
- Github: A web-based Git repository hosting service.
Lessons
The most important lessons from the development of this prototype were:
- Developing a native mobile app takes times and effort specially if the language is new to the developer.
- Define the functionality of the app is key before beginning the code phase. An iterative process with users should be followed to avoid the loss of time and money.
- Prototypes are one of the most value tools for developing technological based tools. Although most of the time, low fidelity are enough. High fidelity or complete prototypes of certain feature. Are highly effective in determine the performance of certain tool or technology.